I have had some people asking me how to graph their data for this assignment.
I would recommend doing this using either Python (my personal preference) or R.
Graphing data in python
I would recommend using python for this.
In python, you can use the MatPlotLib1 library, which is a relatively easy to use plotting library for python.
1 If you feel like being very fancy, try out seaborn, its a plotting library similar to matplotlib, it is harder to use but makes nicer looking graphs.
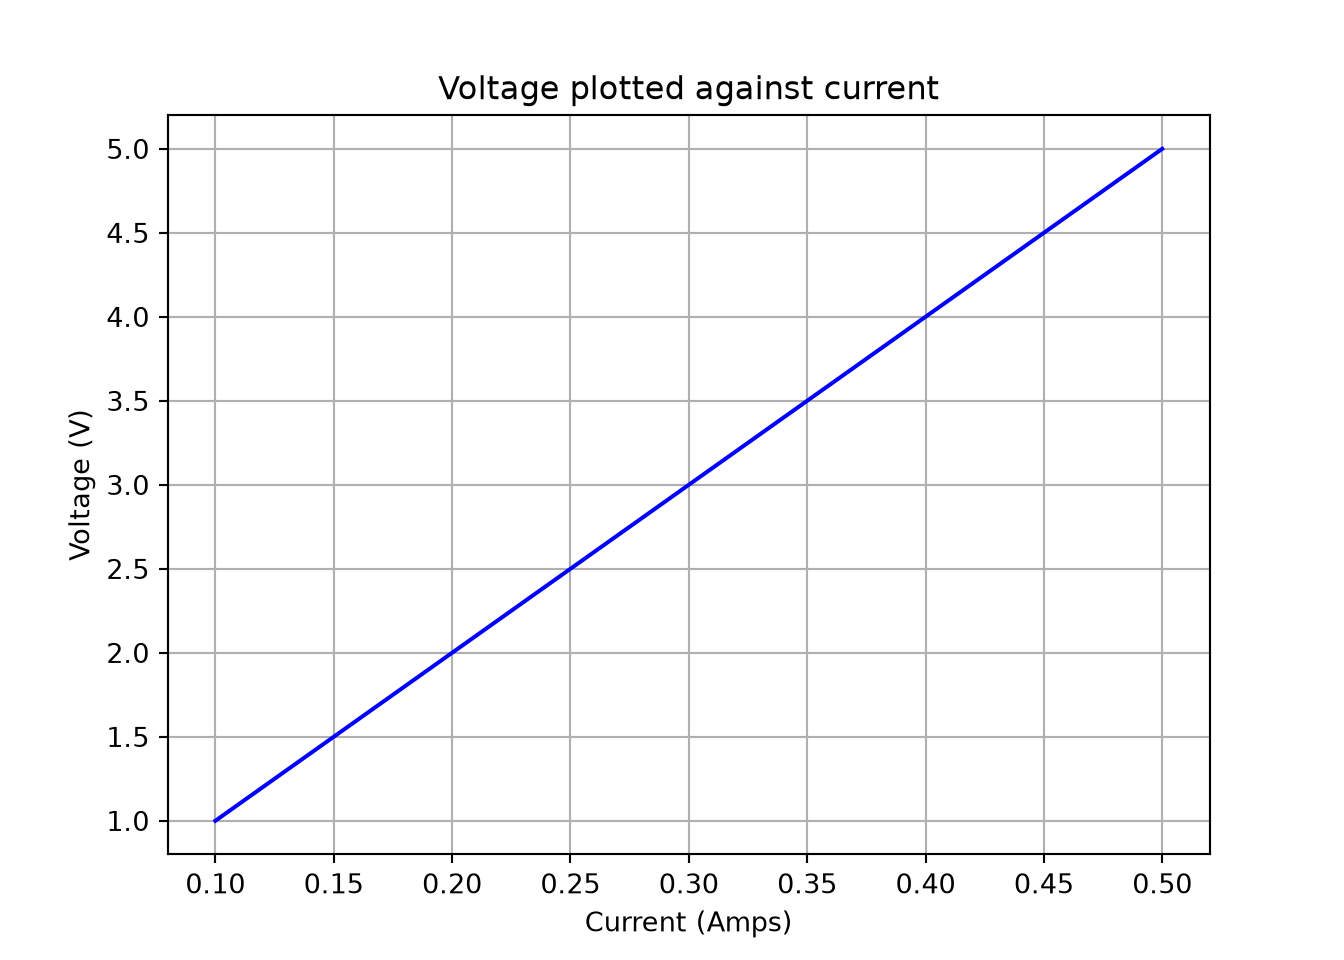
import matplotlib.pyplot as plt# Change these!currents = [ 0.1, 0.2, 0.3, 0.4, 0.5 ]voltages = [ 1, 2, 3, 4, 5 ]plt.plot( currents, # The first argument is the "x" values voltages, # The second argument is the "y" values"b-"# This is the line style, ) # "b-" means a blue solid line# Label the Axesplt.xlabel("Current (Amps)")plt.ylabel("Voltage (V)")# Display a gridplt.grid() # Title the plotplt.title("Voltage plotted against current") # Display the plotplt.show()
Graphing data in R
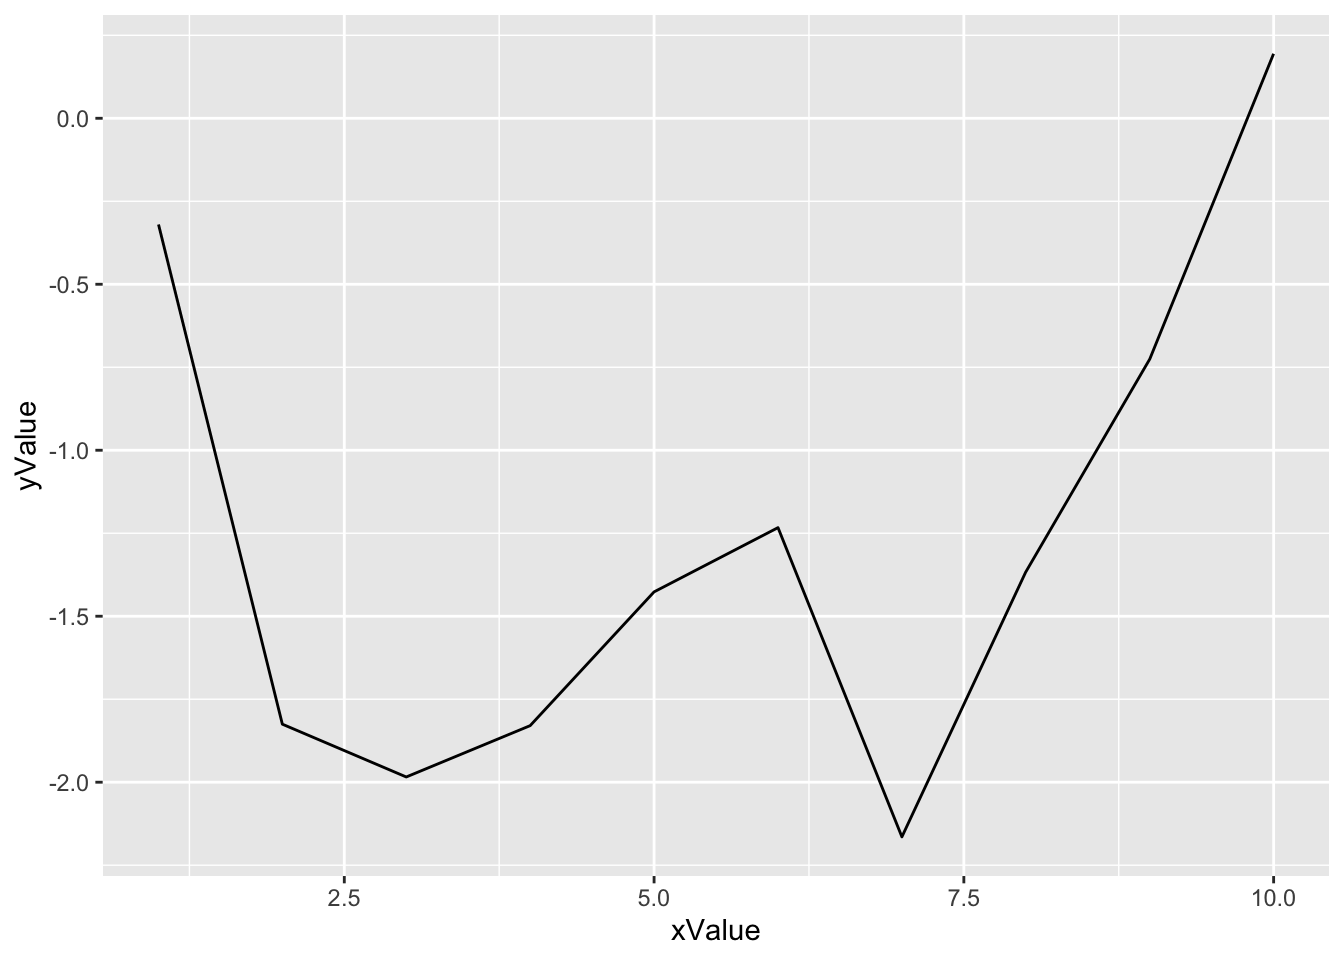
I am less familiar with R, but a lot of you learn it in the CST for statistics. I have been told it is very good.